GGPLOT - position_stack
Stacks bars on top of each other or standardises each stack to have constant height and then convert them with ggplotly.
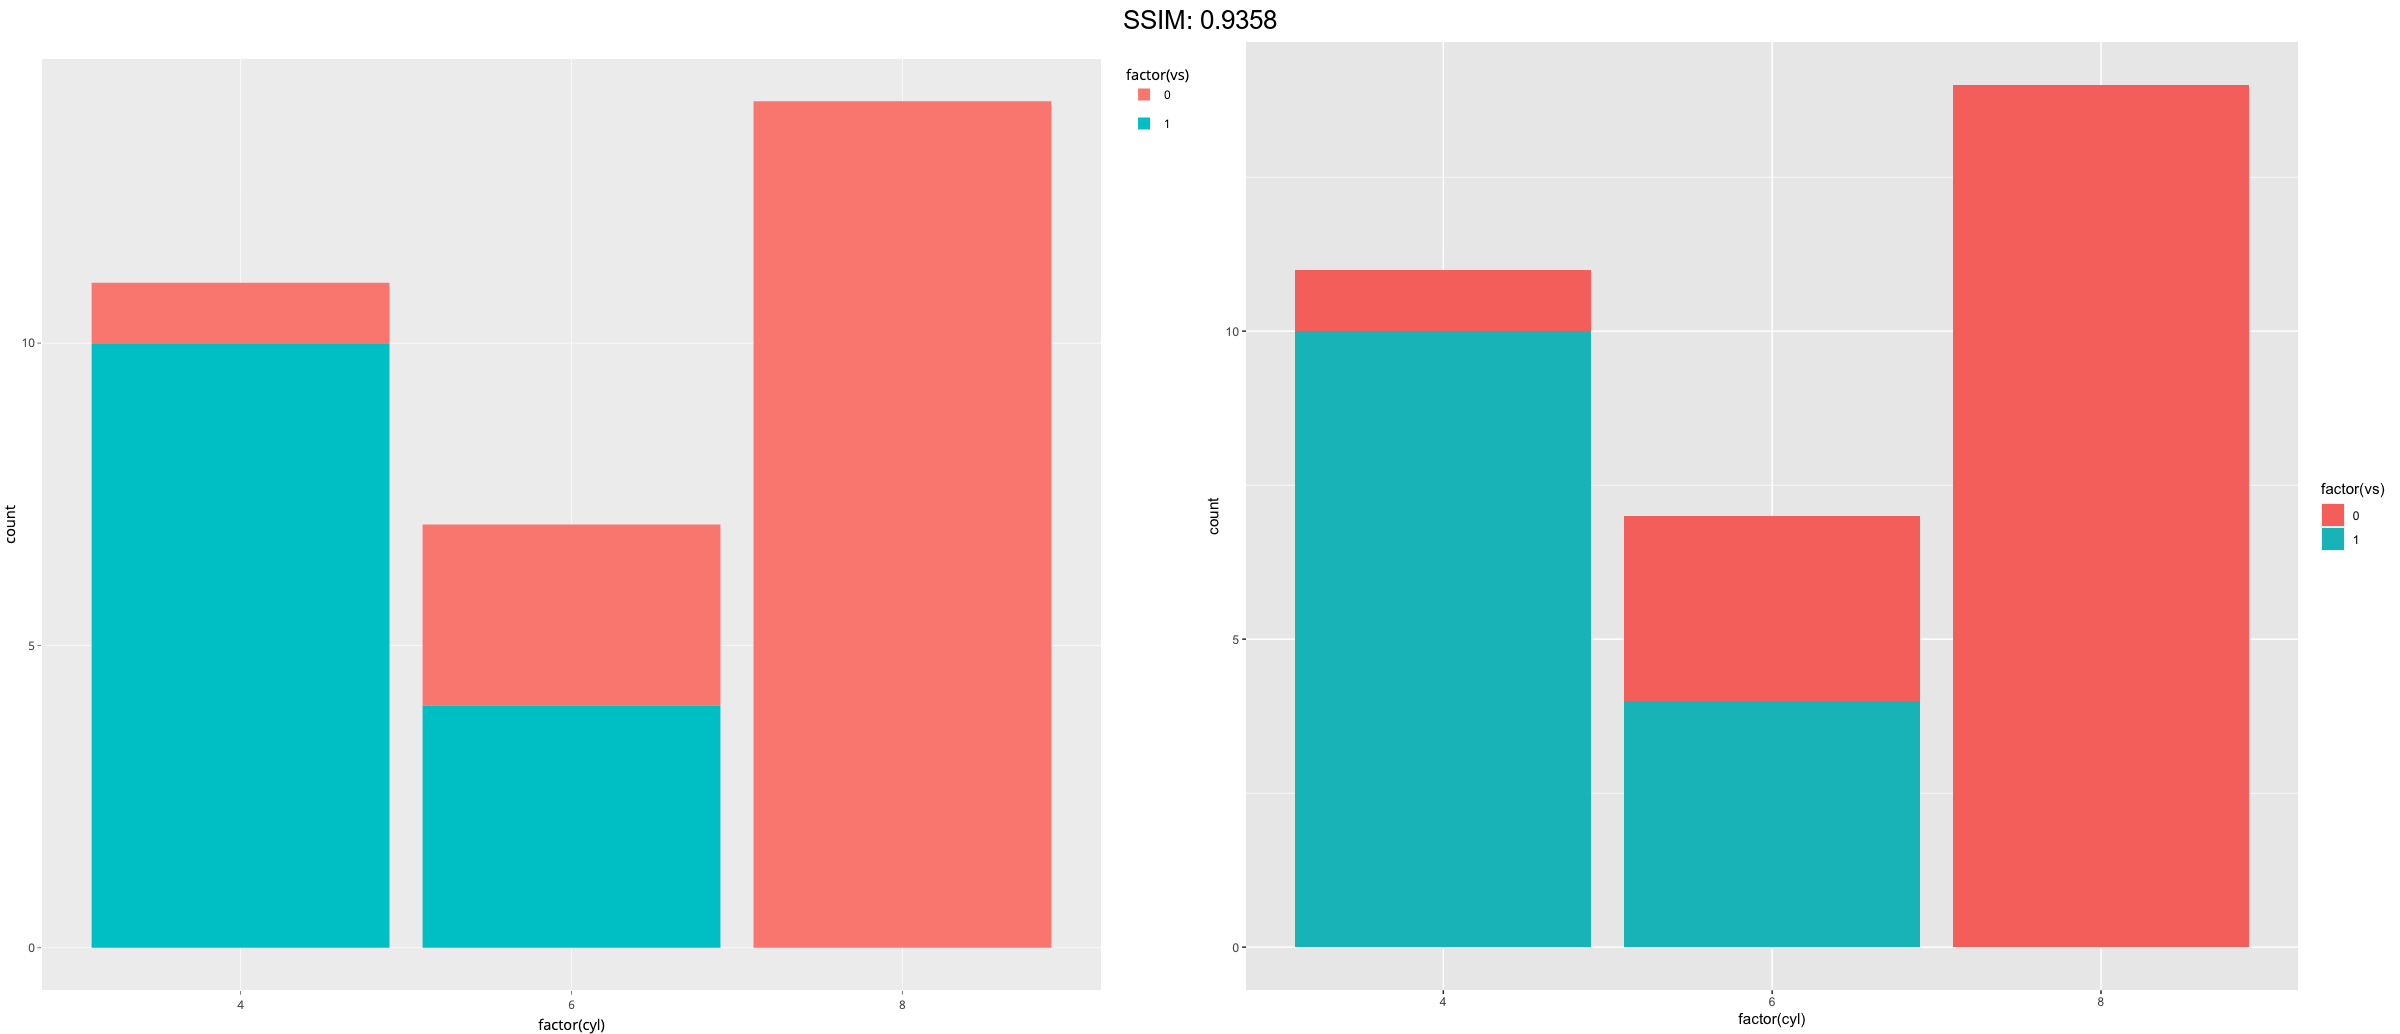
p <-
 ggplot(mtcars, aes(factor(cyl), fill = factor(vs))) +
  geom_bar()
plotly::ggplotly(p)


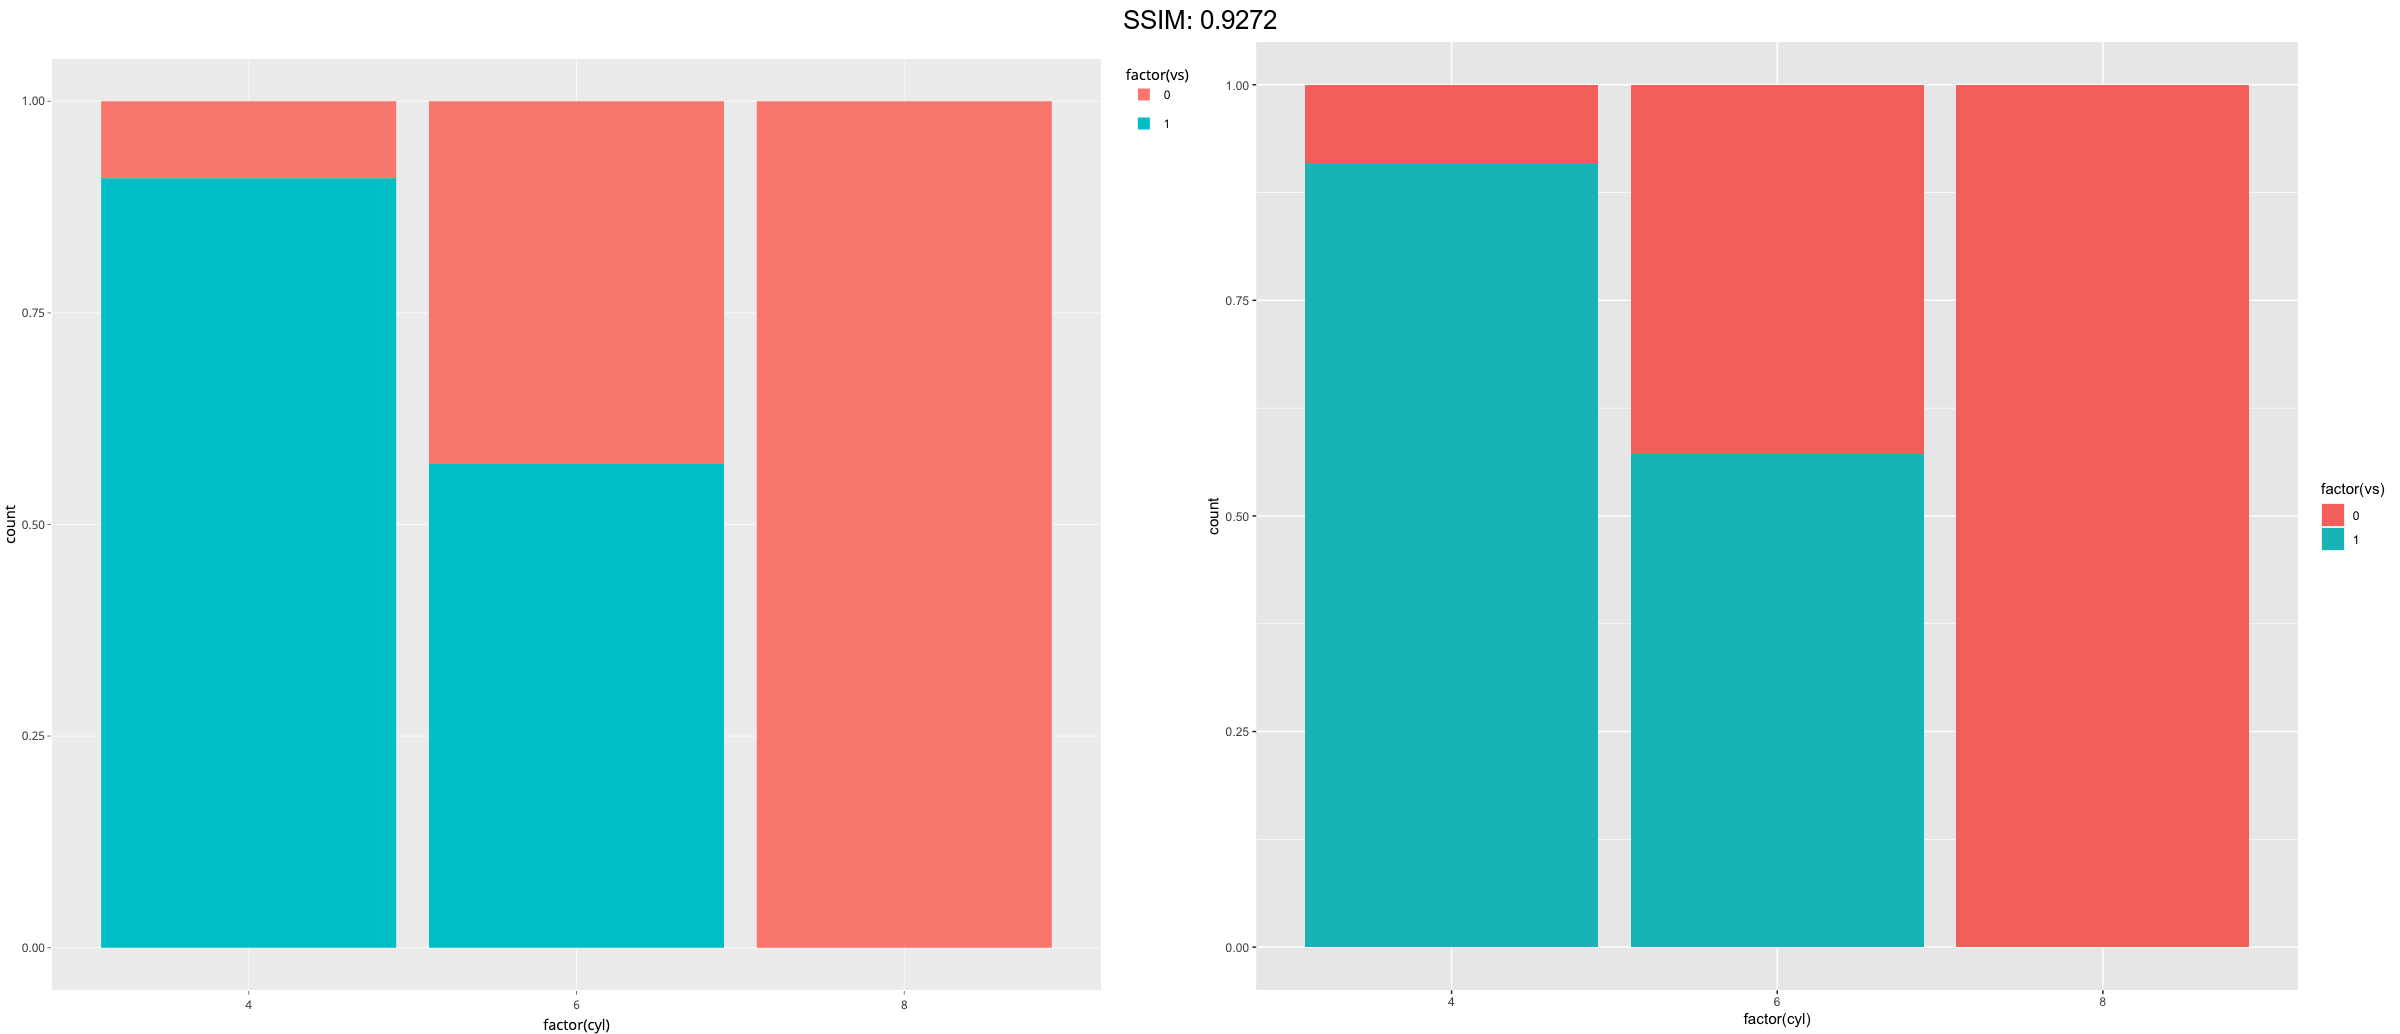
p <-
 ggplot(mtcars, aes(factor(cyl), fill = factor(vs))) +
  geom_bar(position = "fill")
plotly::ggplotly(p)


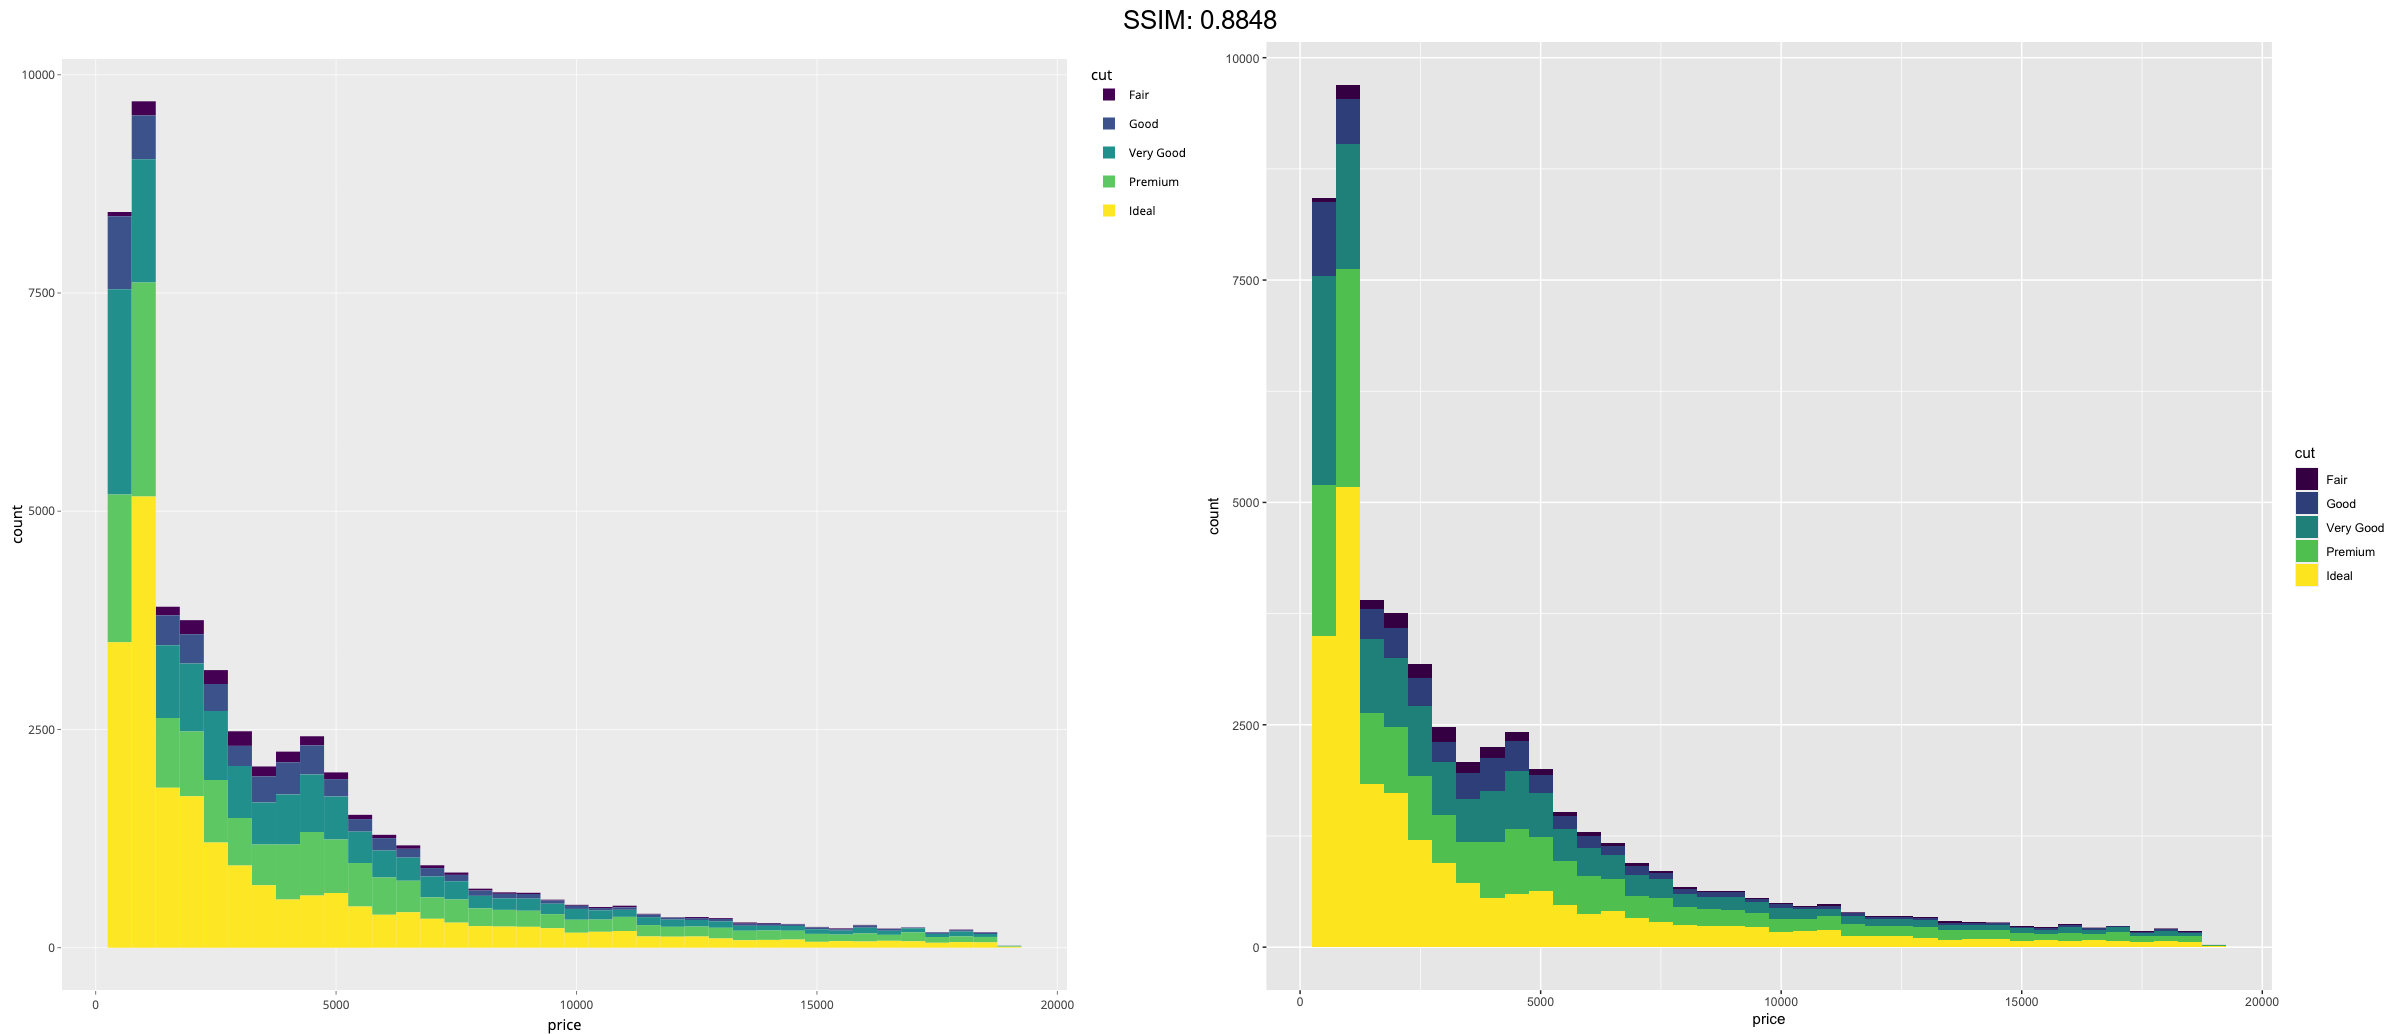
p <-
 ggplot(diamonds, aes(price, fill = cut)) +
  geom_histogram(binwidth = 500)
plotly::ggplotly(p)


p <-
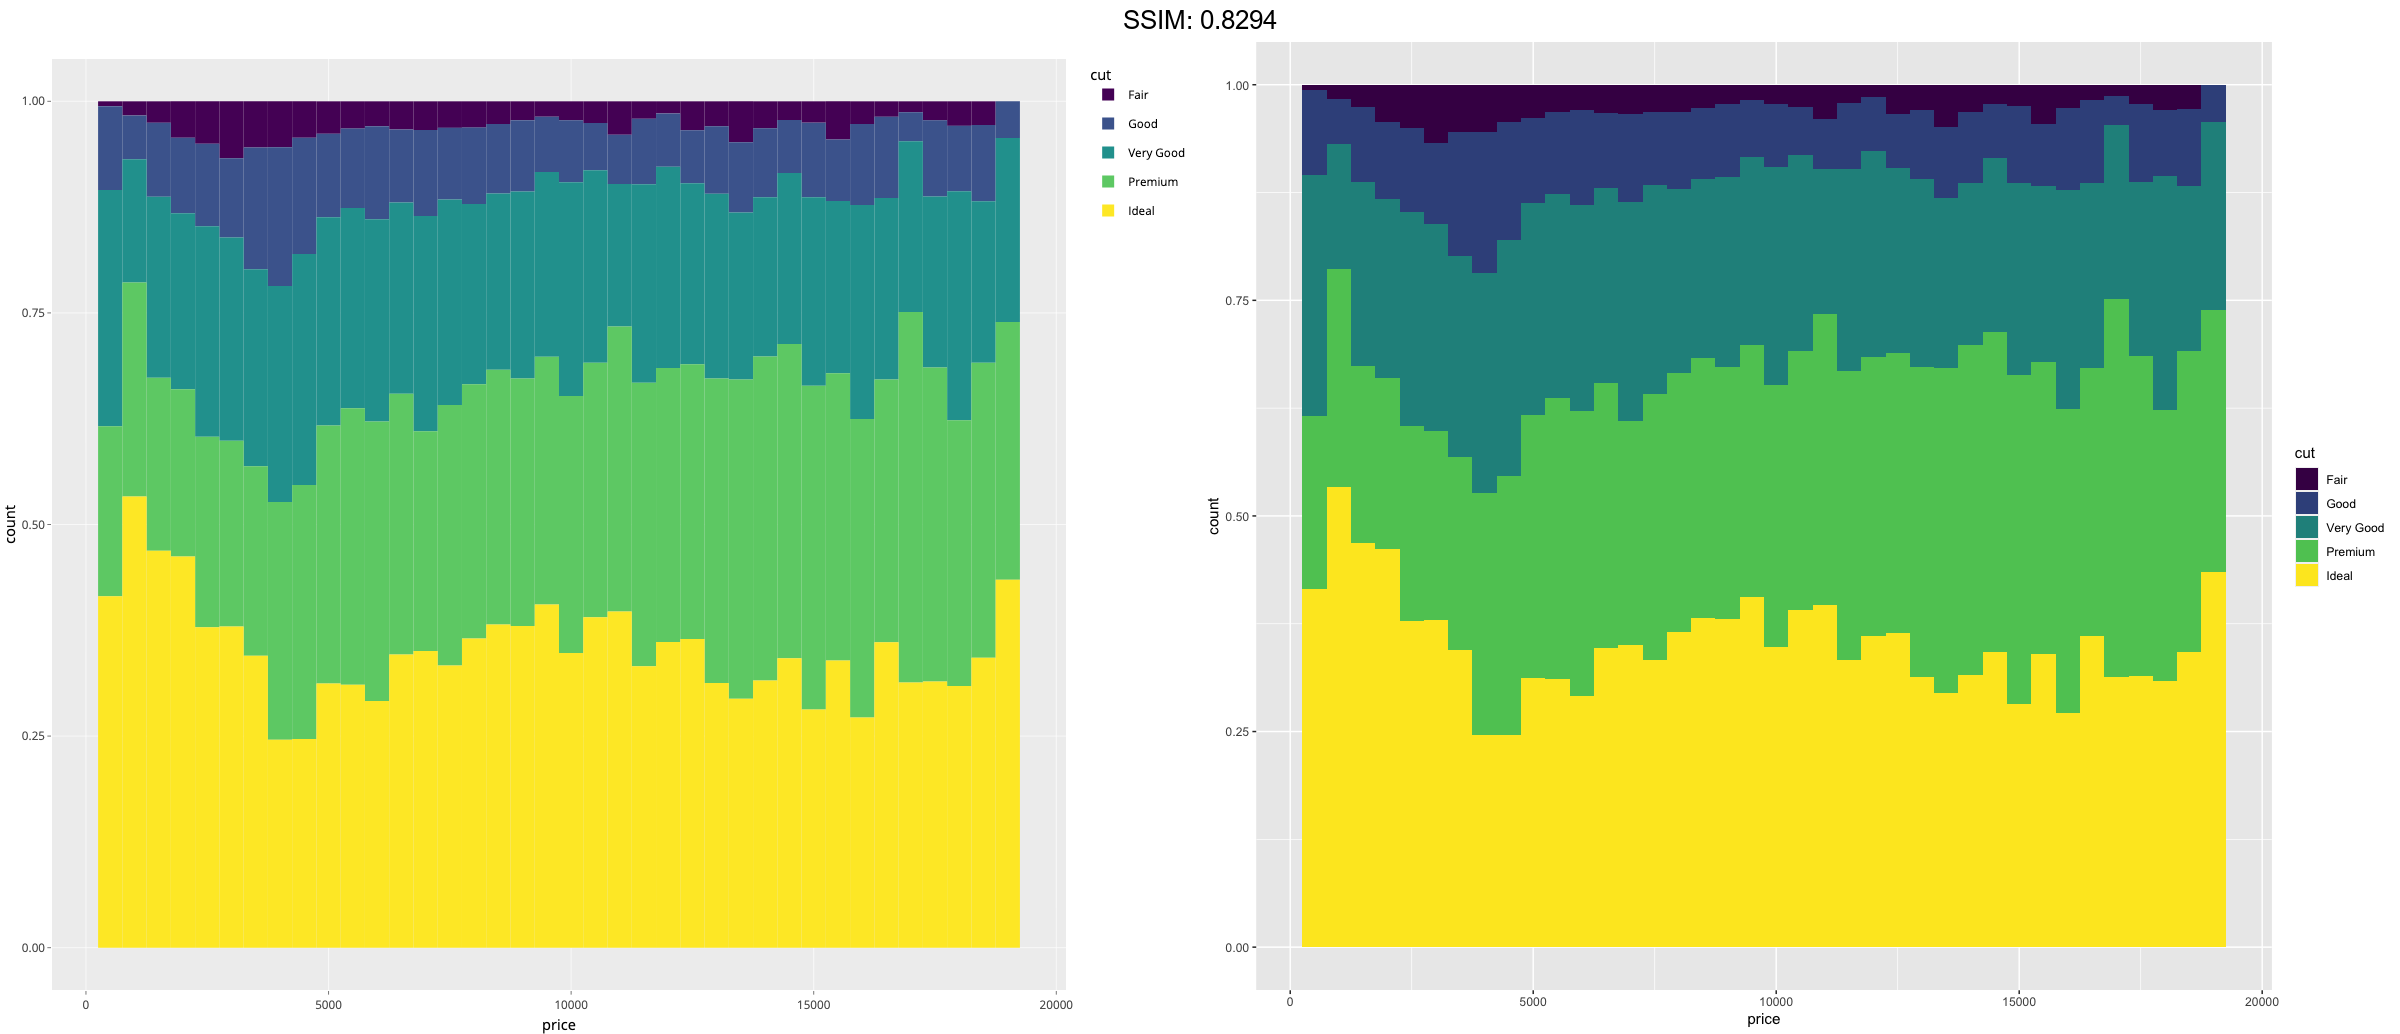
 ggplot(diamonds, aes(price, fill = cut)) +
  geom_histogram(binwidth = 500, position = "fill")
plotly::ggplotly(p)


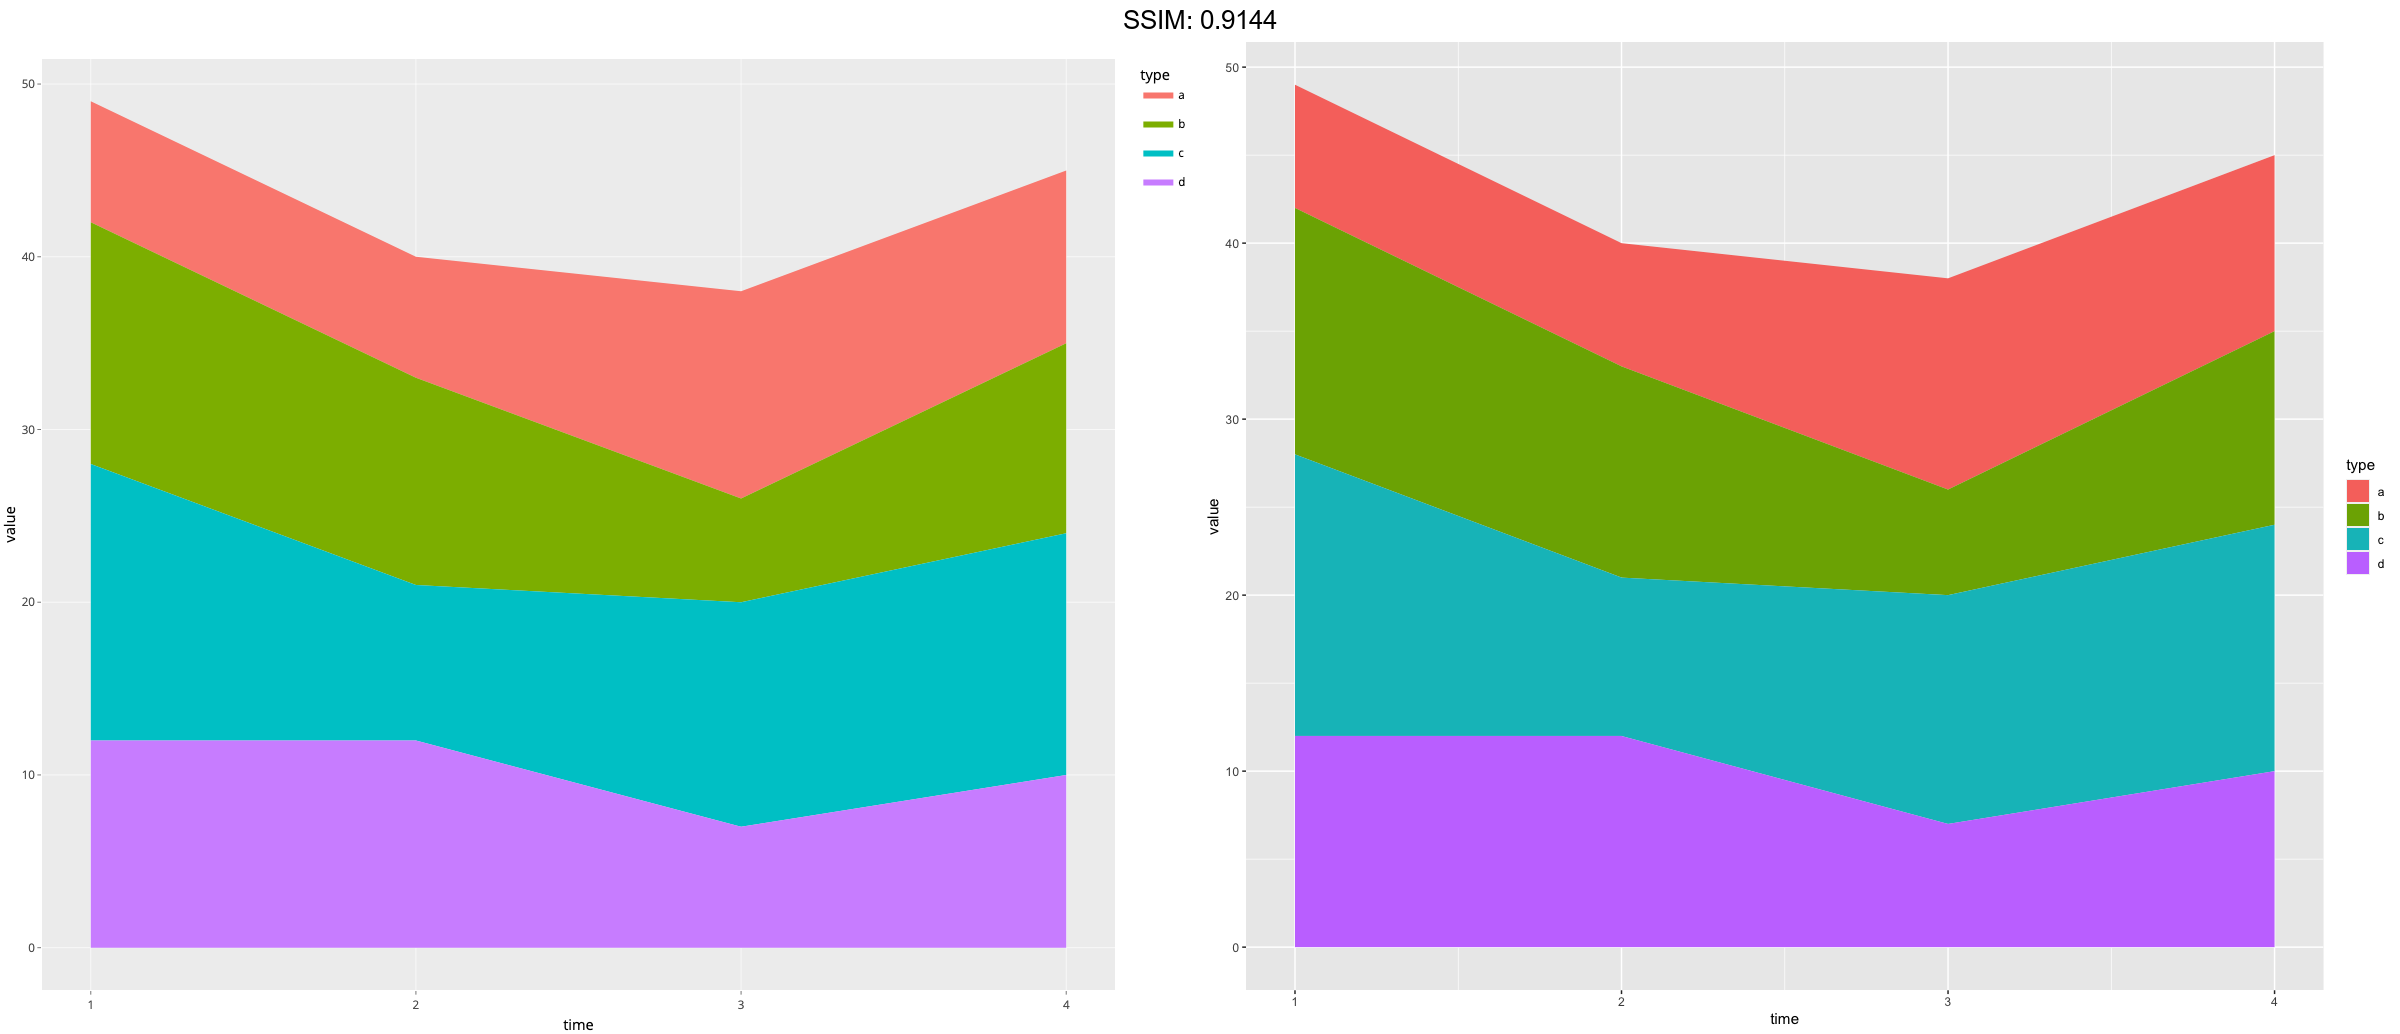
series <- data.frame(
  time = c(rep(1, 4),rep(2, 4), rep(3, 4), rep(4, 4)),
  type = rep(c('a', 'b', 'c', 'd'), 4),
  value = rpois(16, 10)
)
p <-
 ggplot(series, aes(time, value)) +
  geom_area(aes(fill = type))
plotly::ggplotly(p)


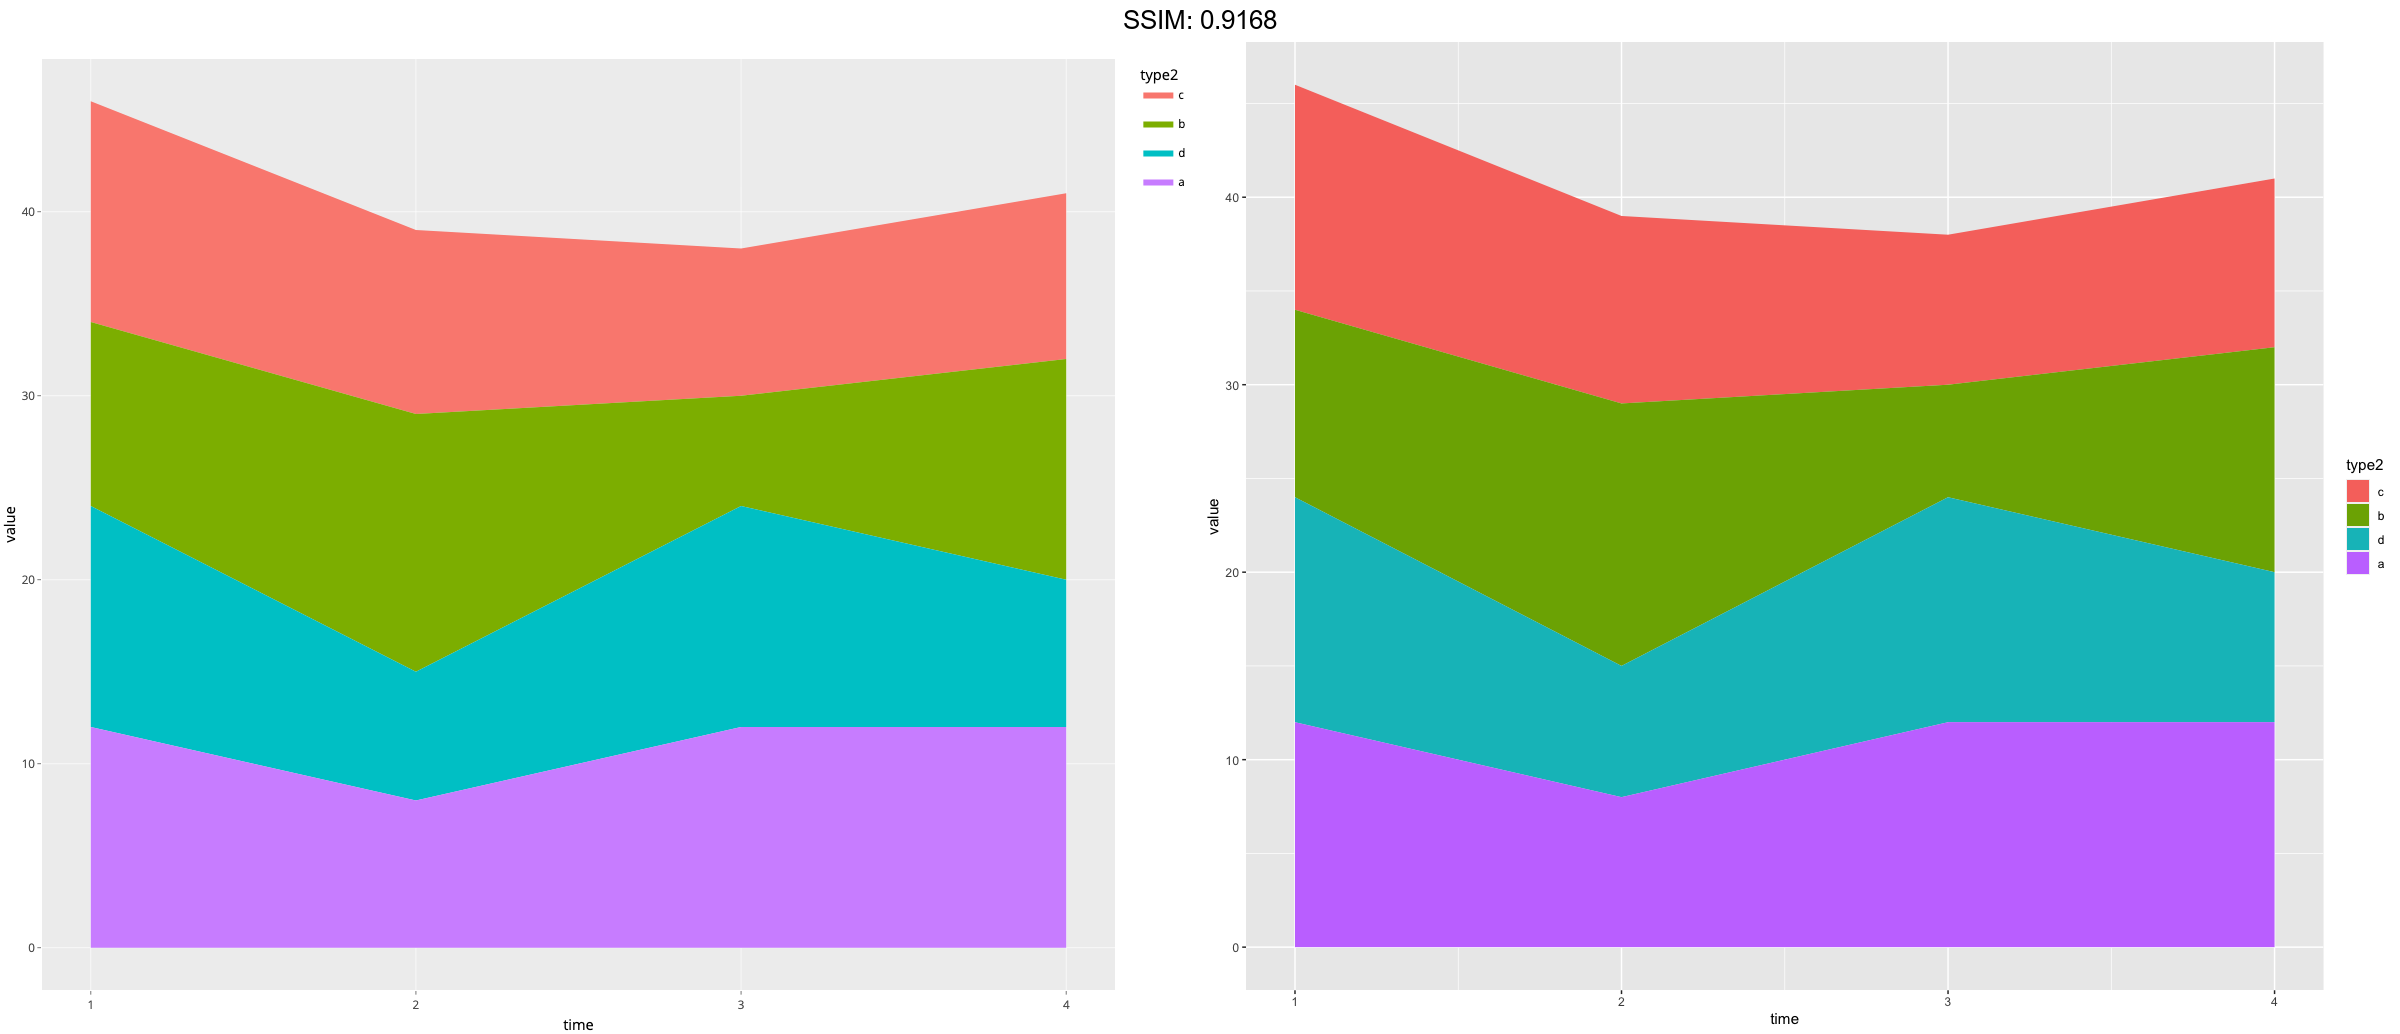
series <- data.frame(
  time = c(rep(1, 4),rep(2, 4), rep(3, 4), rep(4, 4)),
  type = rep(c('a', 'b', 'c', 'd'), 4),
  value = rpois(16, 10)
)
series$type2 <- factor(series$type, levels = c('c', 'b', 'd', 'a'))
p <-
 ggplot(series, aes(time, value)) +
  geom_area(aes(fill = type2))
plotly::ggplotly(p)


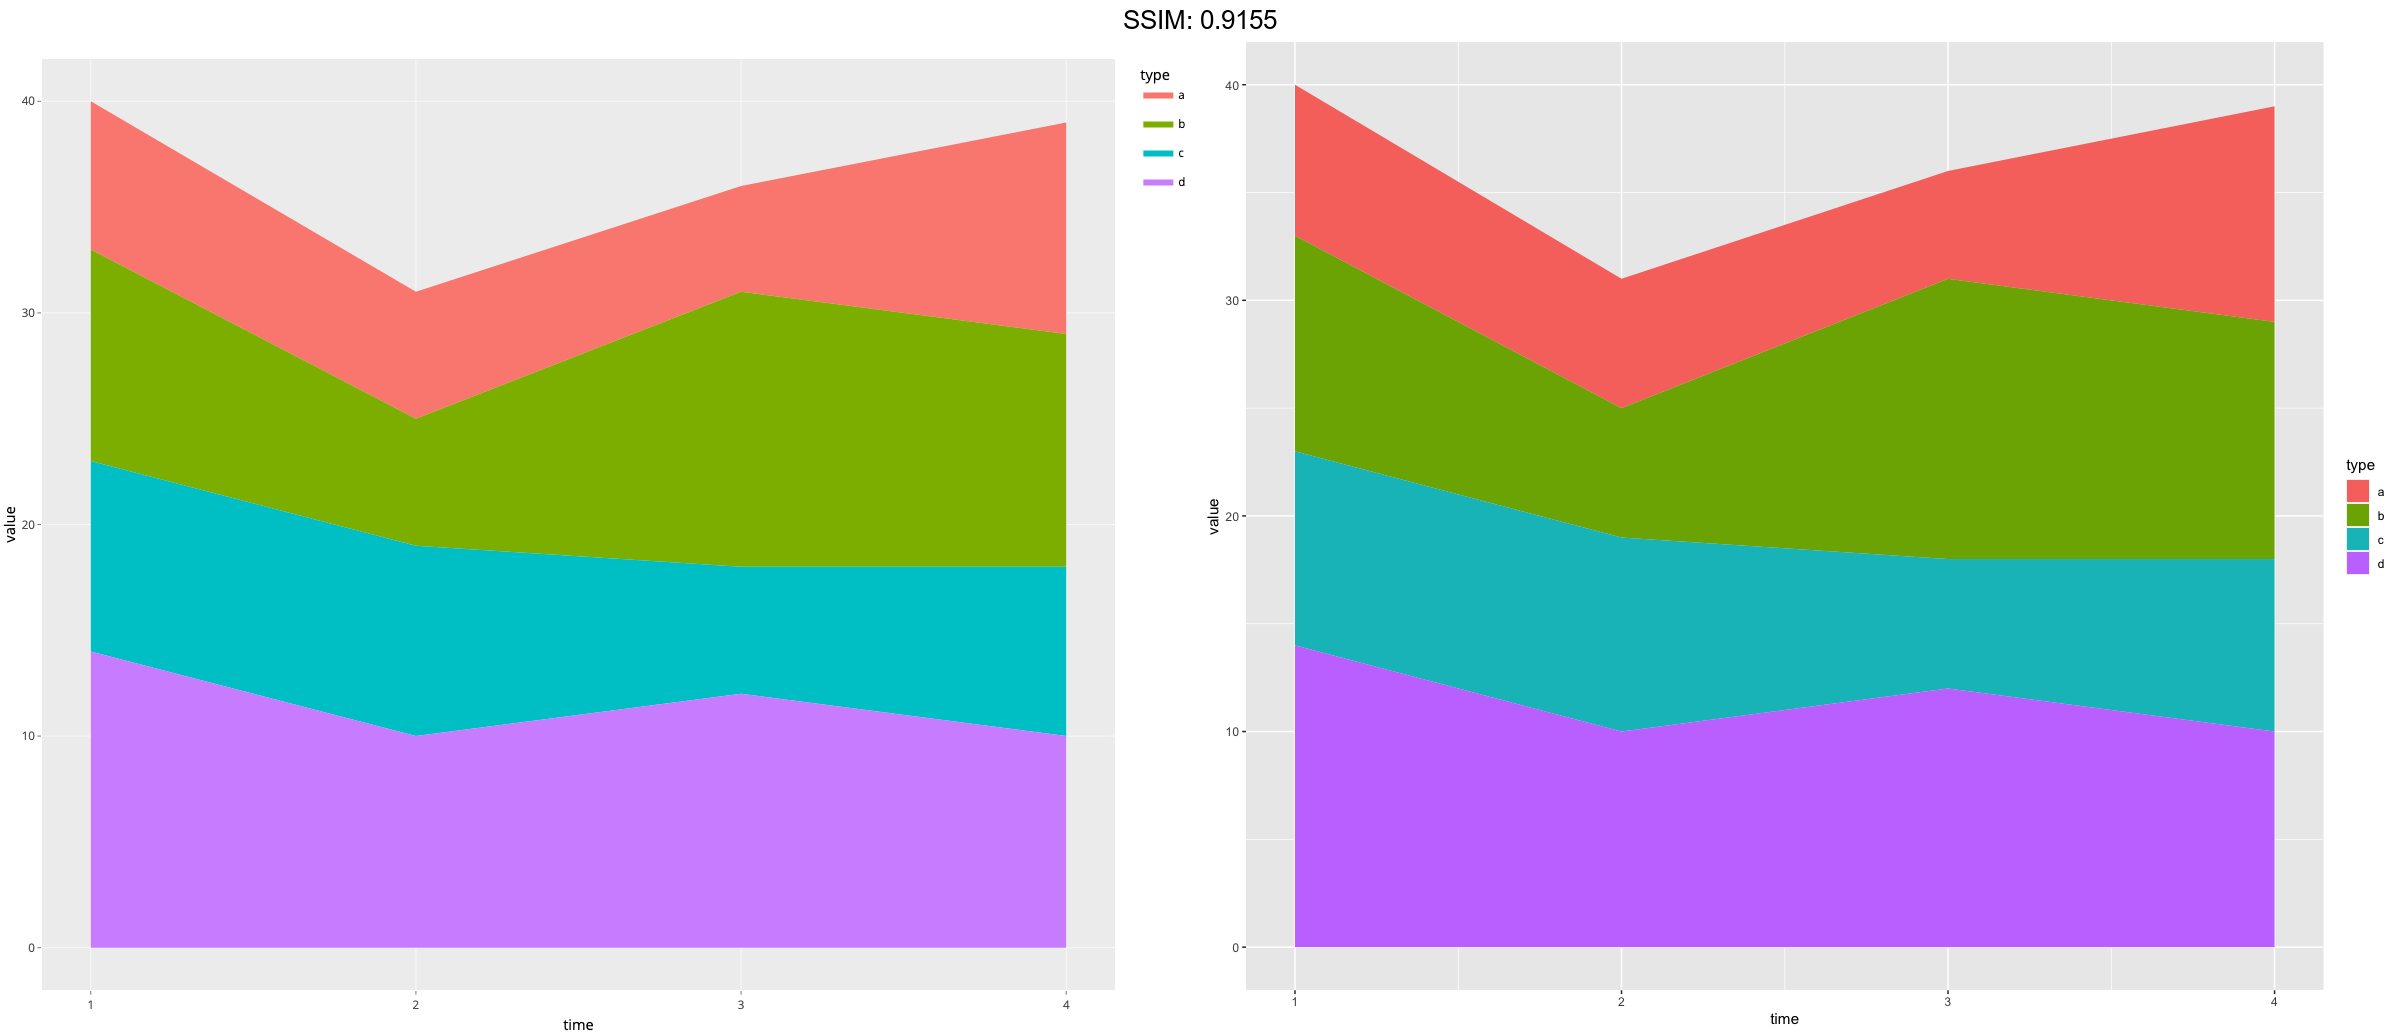
series <- data.frame(
  time = c(rep(1, 4),rep(2, 4), rep(3, 4), rep(4, 4)),
  type = rep(c('a', 'b', 'c', 'd'), 4),
  value = rpois(16, 10)
)
series$type2 <- factor(series$type, levels = c('c', 'b', 'd', 'a'))
p <-
 ggplot(series, aes(time, value)) +
  geom_area(aes(fill = type)) +
  scale_fill_discrete(breaks = c('a', 'b', 'c', 'd'))
plotly::ggplotly(p)


series <- data.frame(
  time = c(rep(1, 4),rep(2, 4), rep(3, 4), rep(4, 4)),
  type = rep(c('a', 'b', 'c', 'd'), 4),
  value = rpois(16, 10)
)
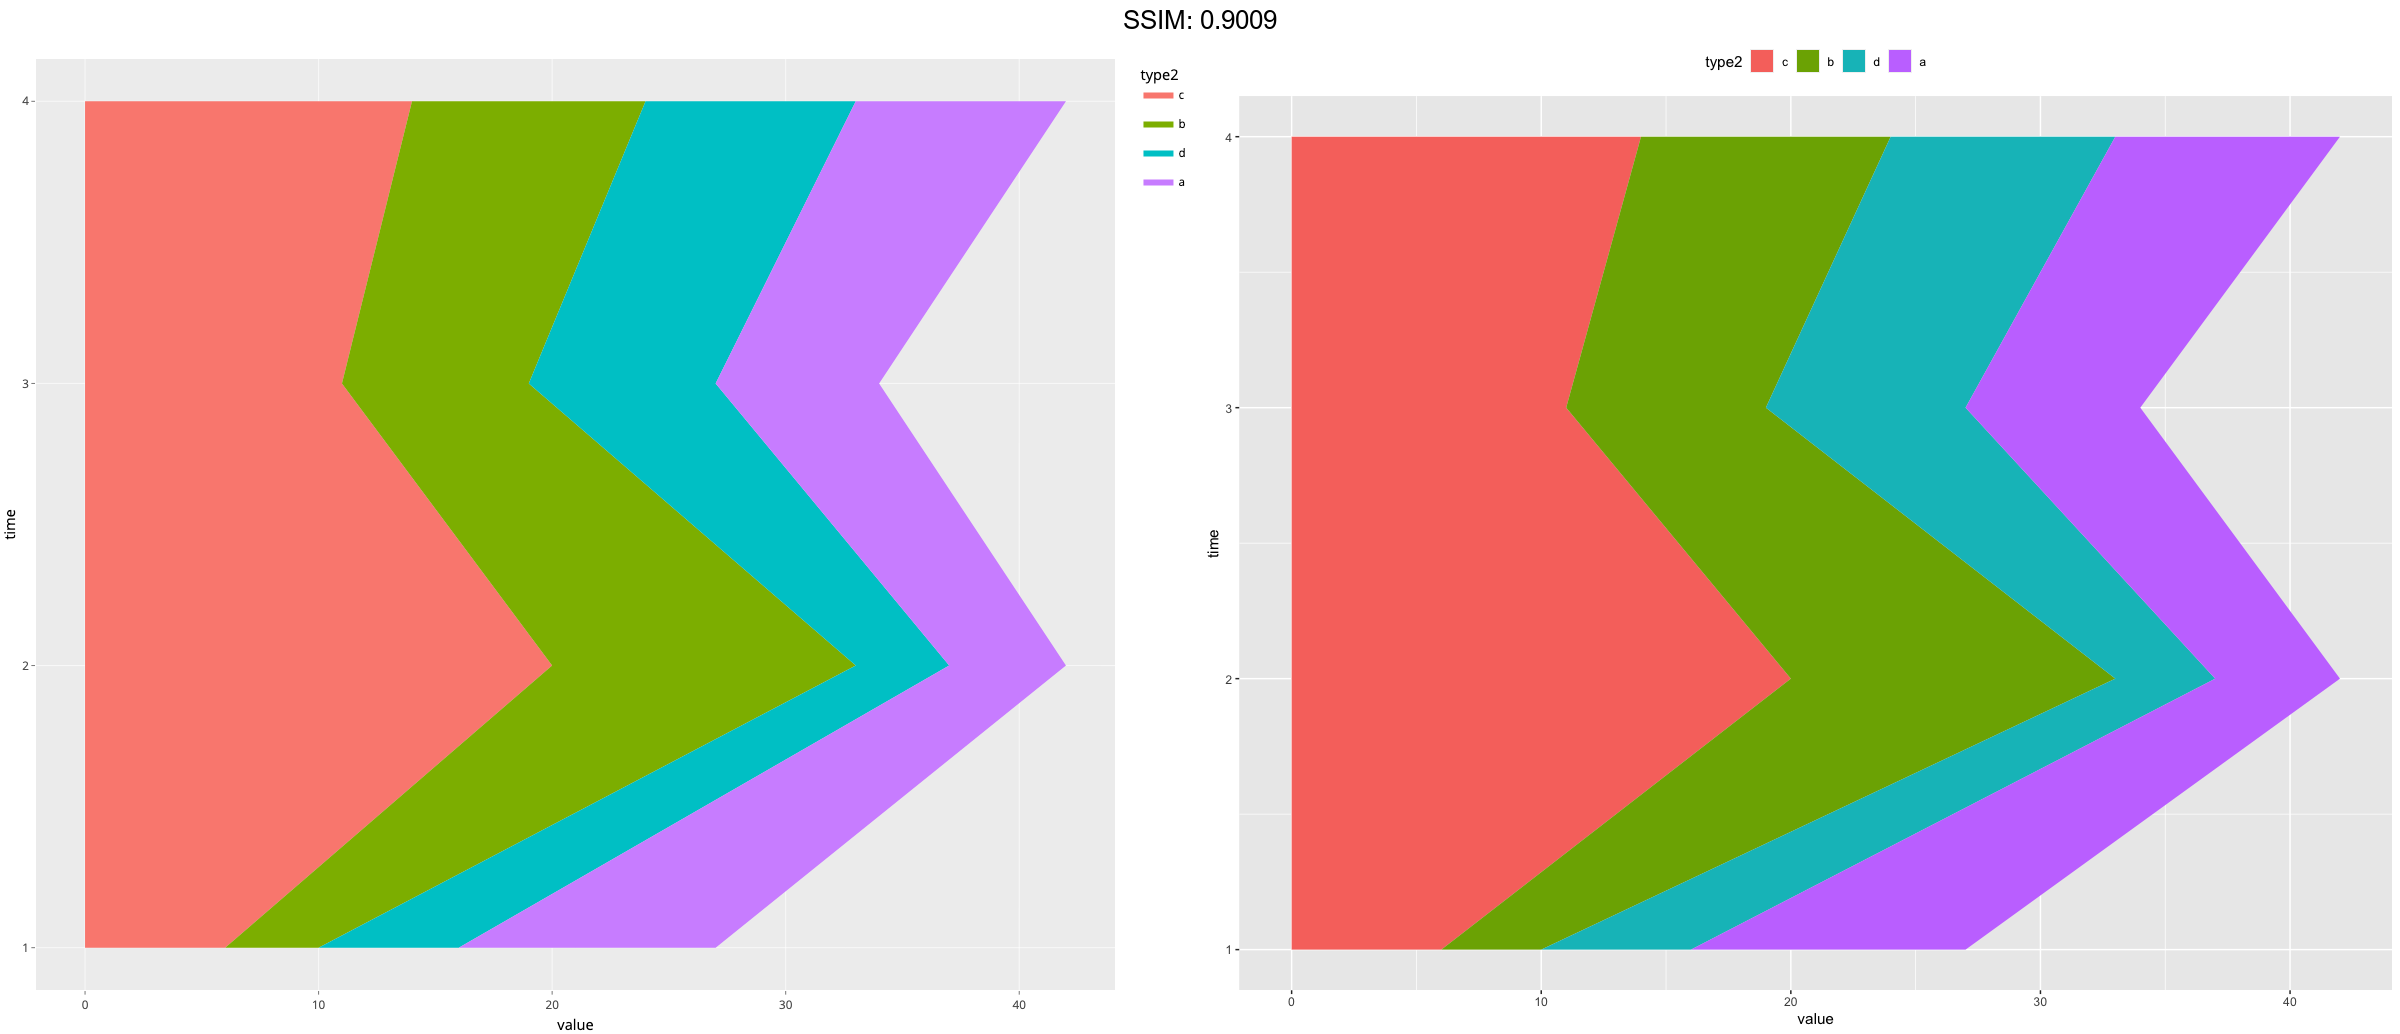
series$type2 <- factor(series$type, levels = c('c', 'b', 'd', 'a'))
p <-
 ggplot(series, aes(time, value)) +
  geom_area(aes(fill = type2), position = position_stack(reverse = TRUE)) +
  coord_flip() +
  theme(legend.position = "top")
plotly::ggplotly(p)


series <- data.frame(
  time = c(rep(1, 4),rep(2, 4), rep(3, 4), rep(4, 4)),
  type = rep(c('a', 'b', 'c', 'd'), 4),
  value = rpois(16, 10)
)
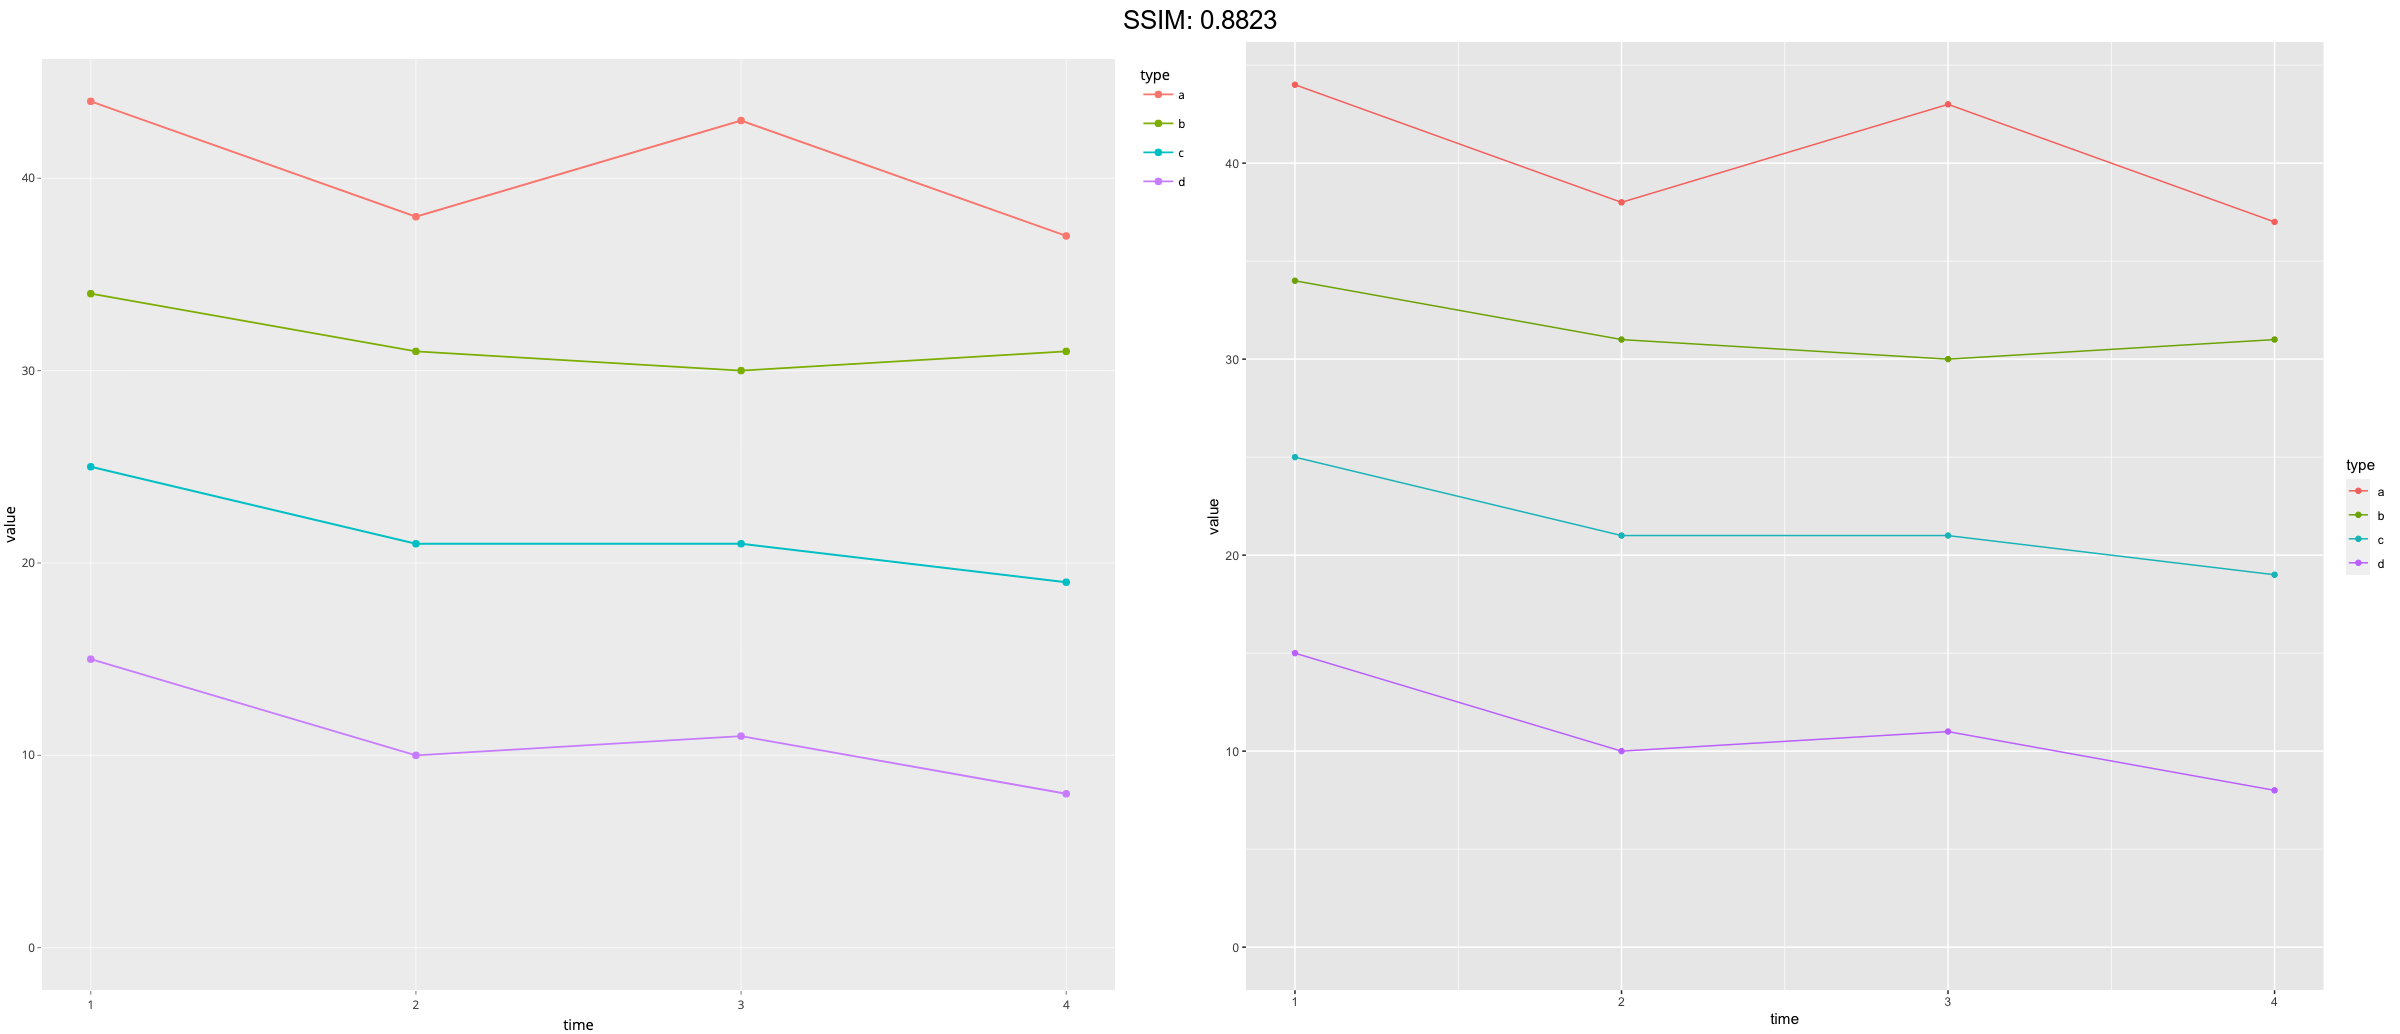
series$type2 <- factor(series$type, levels = c('c', 'b', 'd', 'a'))
p <-
 ggplot(series, aes(time, value, group = type)) +
  geom_line(aes(colour = type), position = "stack") +
  geom_point(aes(colour = type), position = "stack")
plotly::ggplotly(p)


series <- data.frame(
  time = c(rep(1, 4),rep(2, 4), rep(3, 4), rep(4, 4)),
  type = rep(c('a', 'b', 'c', 'd'), 4),
  value = rpois(16, 10)
)
series$type2 <- factor(series$type, levels = c('c', 'b', 'd', 'a'))
p <-
 ggplot(series, aes(time, value, group = type)) +
  geom_area(aes(fill = type)) +
  geom_line(aes(group = type), position = "stack")
plotly::ggplotly(p)


series <- data.frame(
  time = c(rep(1, 4),rep(2, 4), rep(3, 4), rep(4, 4)),
  type = rep(c('a', 'b', 'c', 'd'), 4),
  value = rpois(16, 10)
)
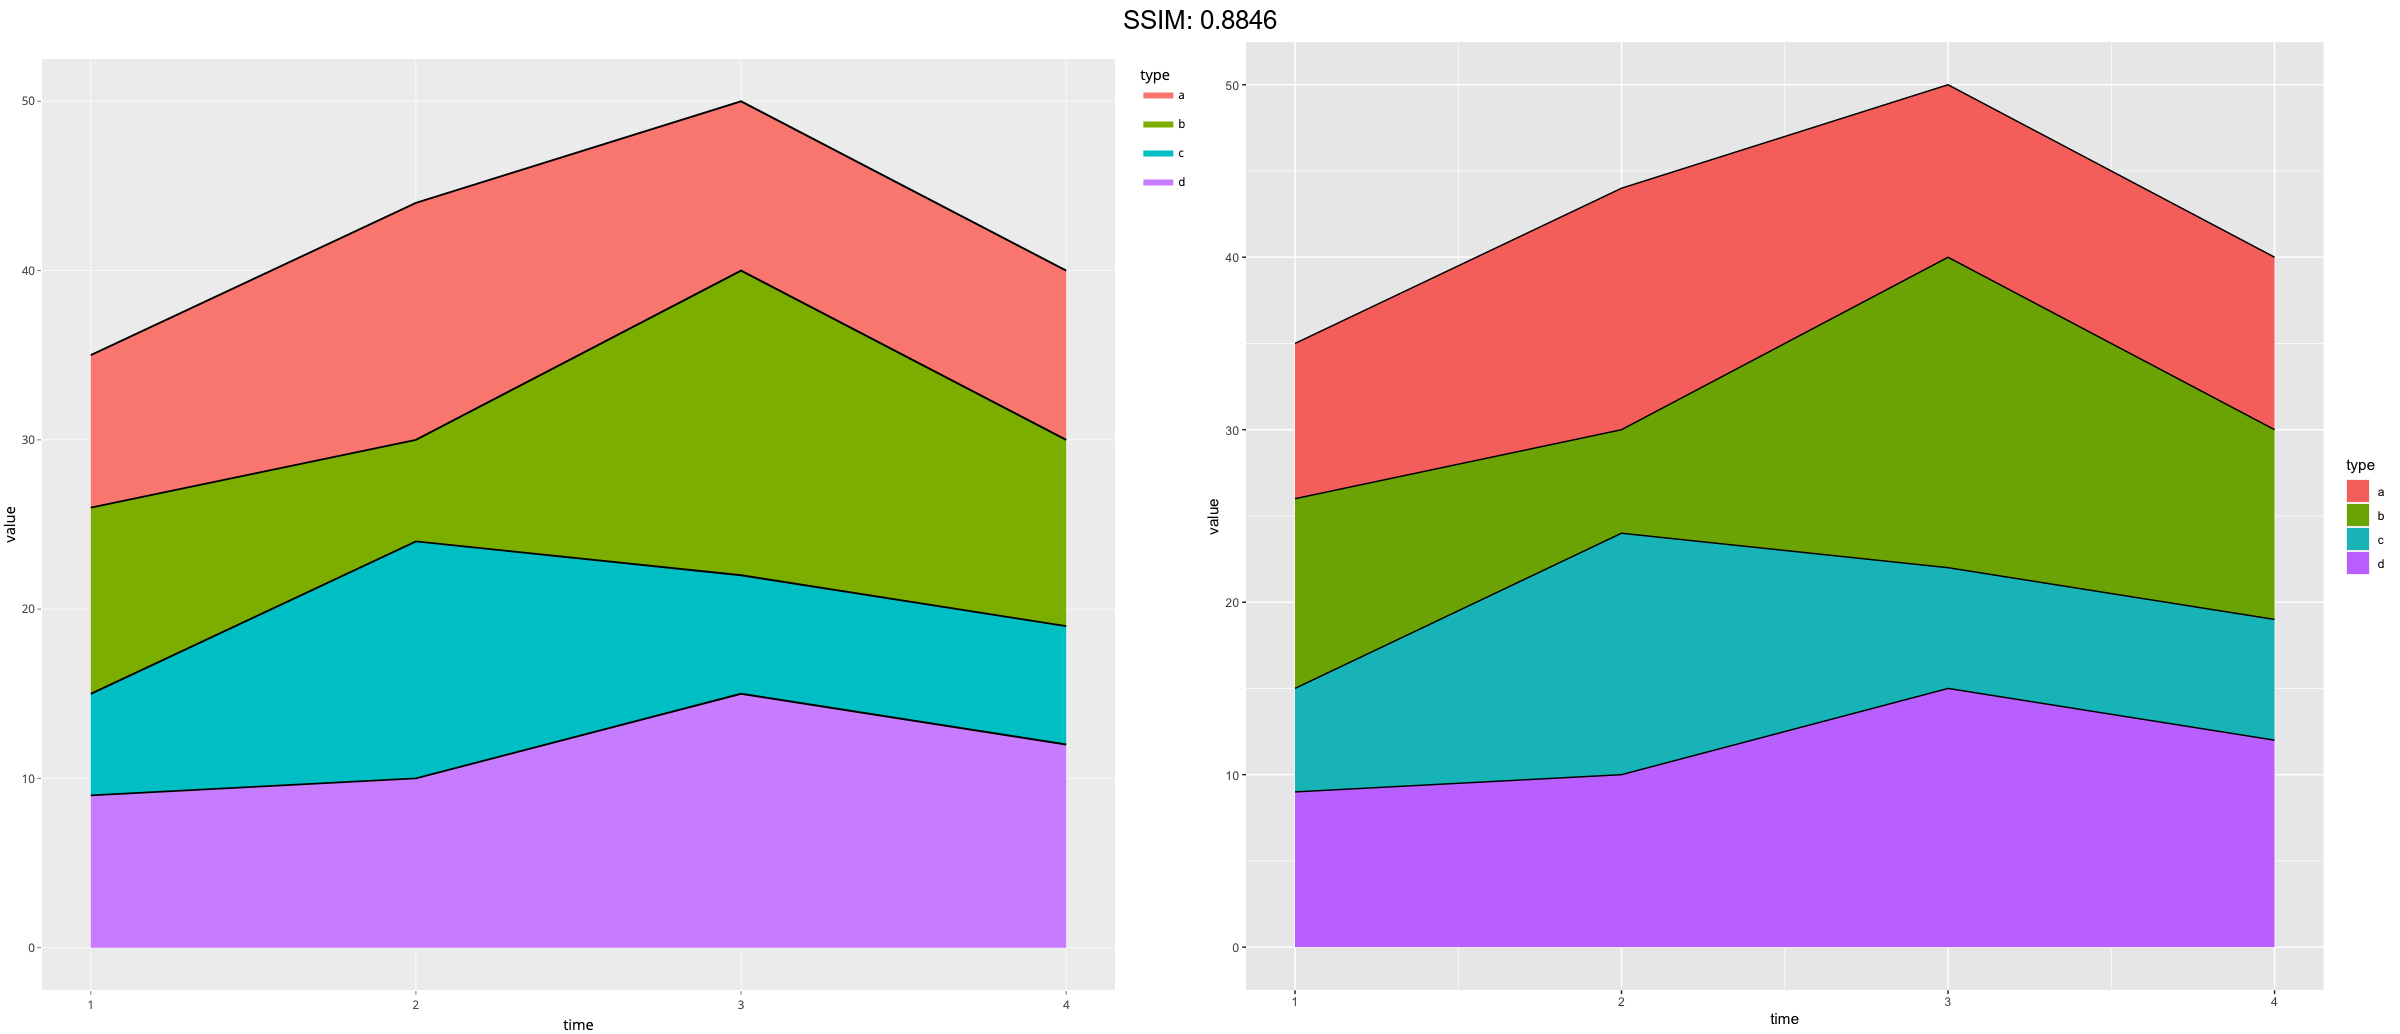
series$type2 <- factor(series$type, levels = c('c', 'b', 'd', 'a'))
p <-
 ggplot(series, aes(time, value, group = type)) +
  geom_area(aes(fill = type)) +
  geom_line(aes(group = type), position = "stack")
plotly::ggplotly(p)


series <- data.frame(
  time = c(rep(1, 4),rep(2, 4), rep(3, 4), rep(4, 4)),
  type = rep(c('a', 'b', 'c', 'd'), 4),
  value = rpois(16, 10)
)
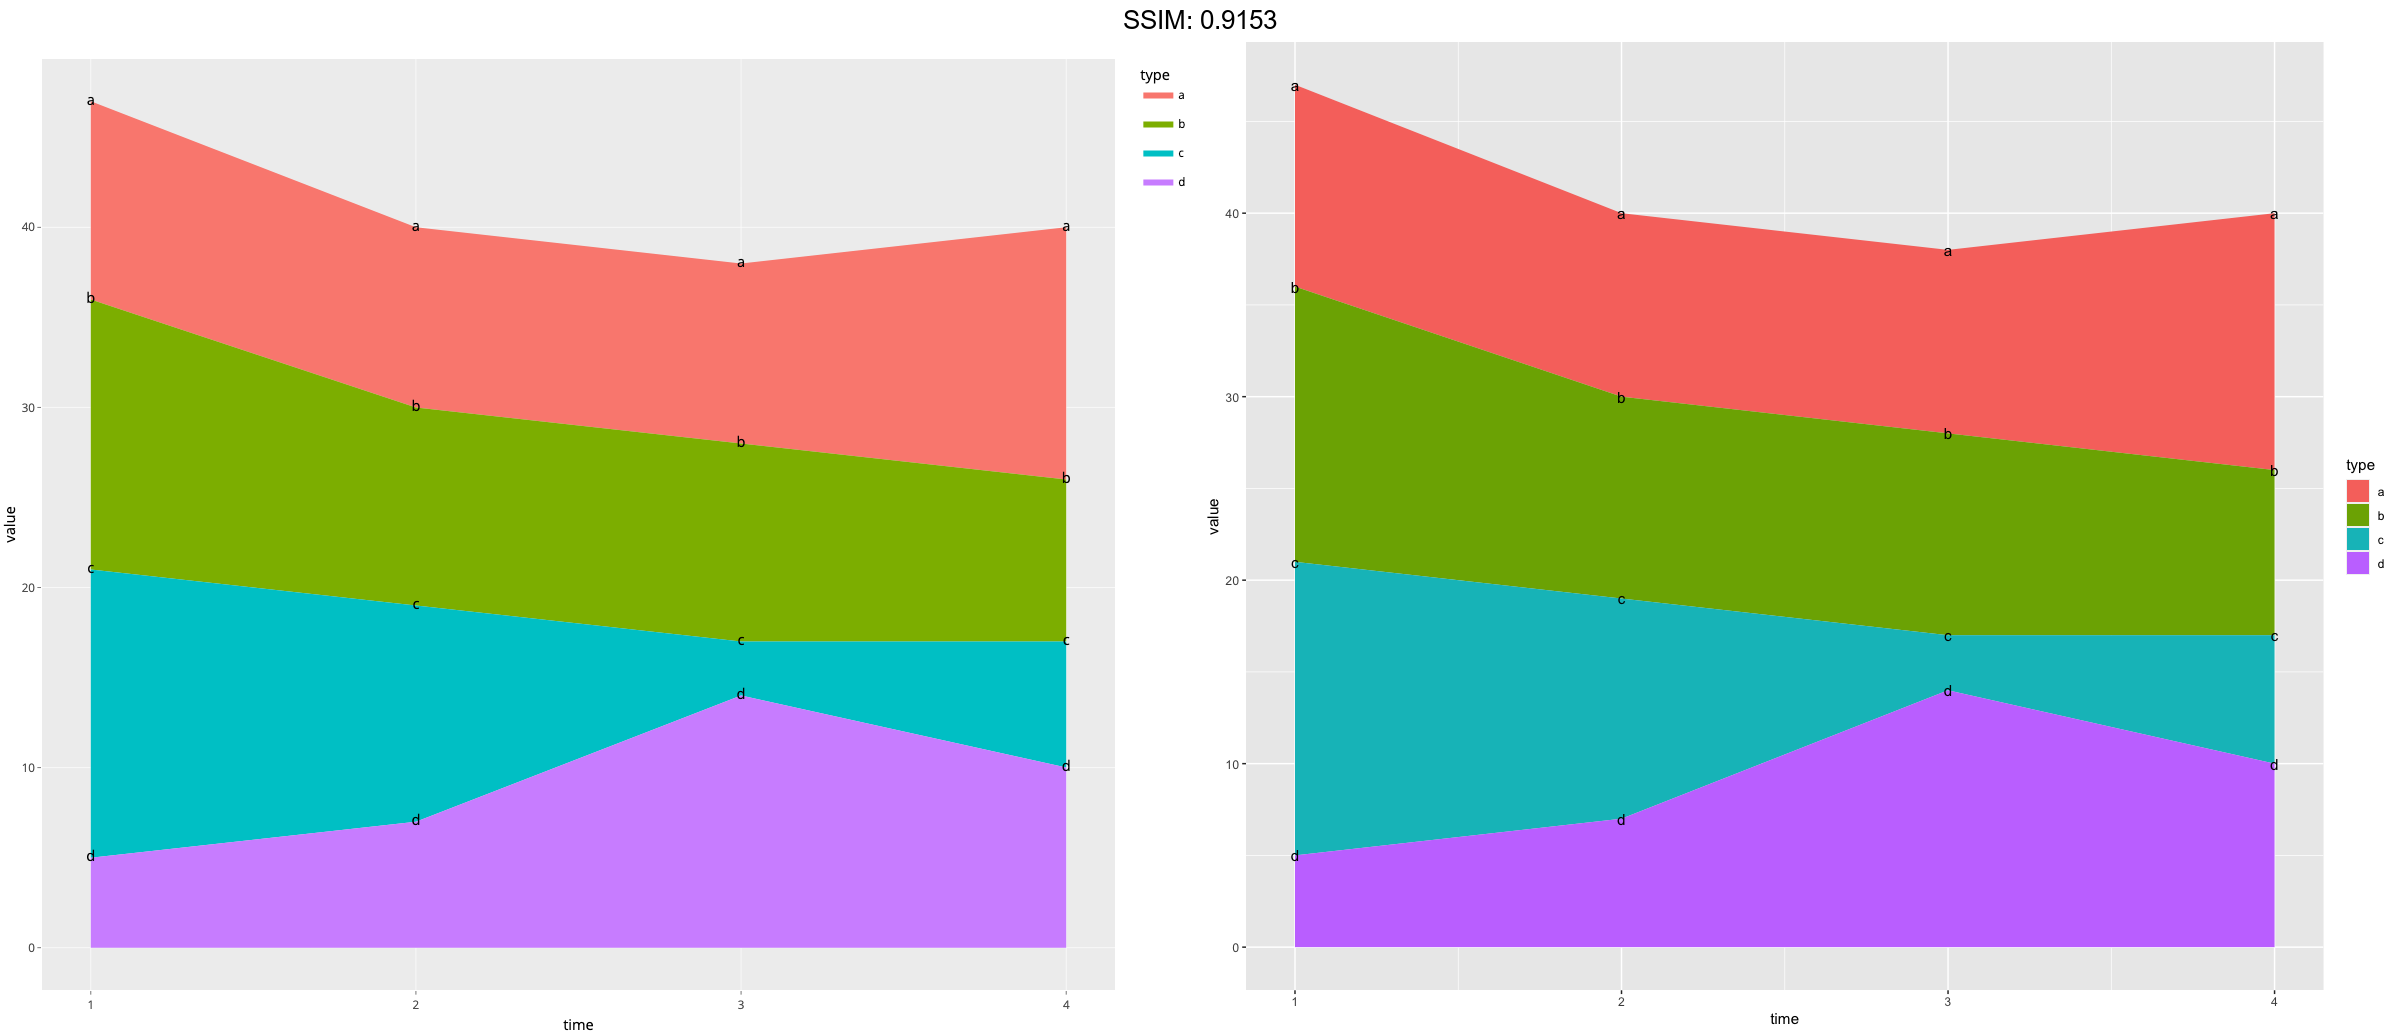
series$type2 <- factor(series$type, levels = c('c', 'b', 'd', 'a'))
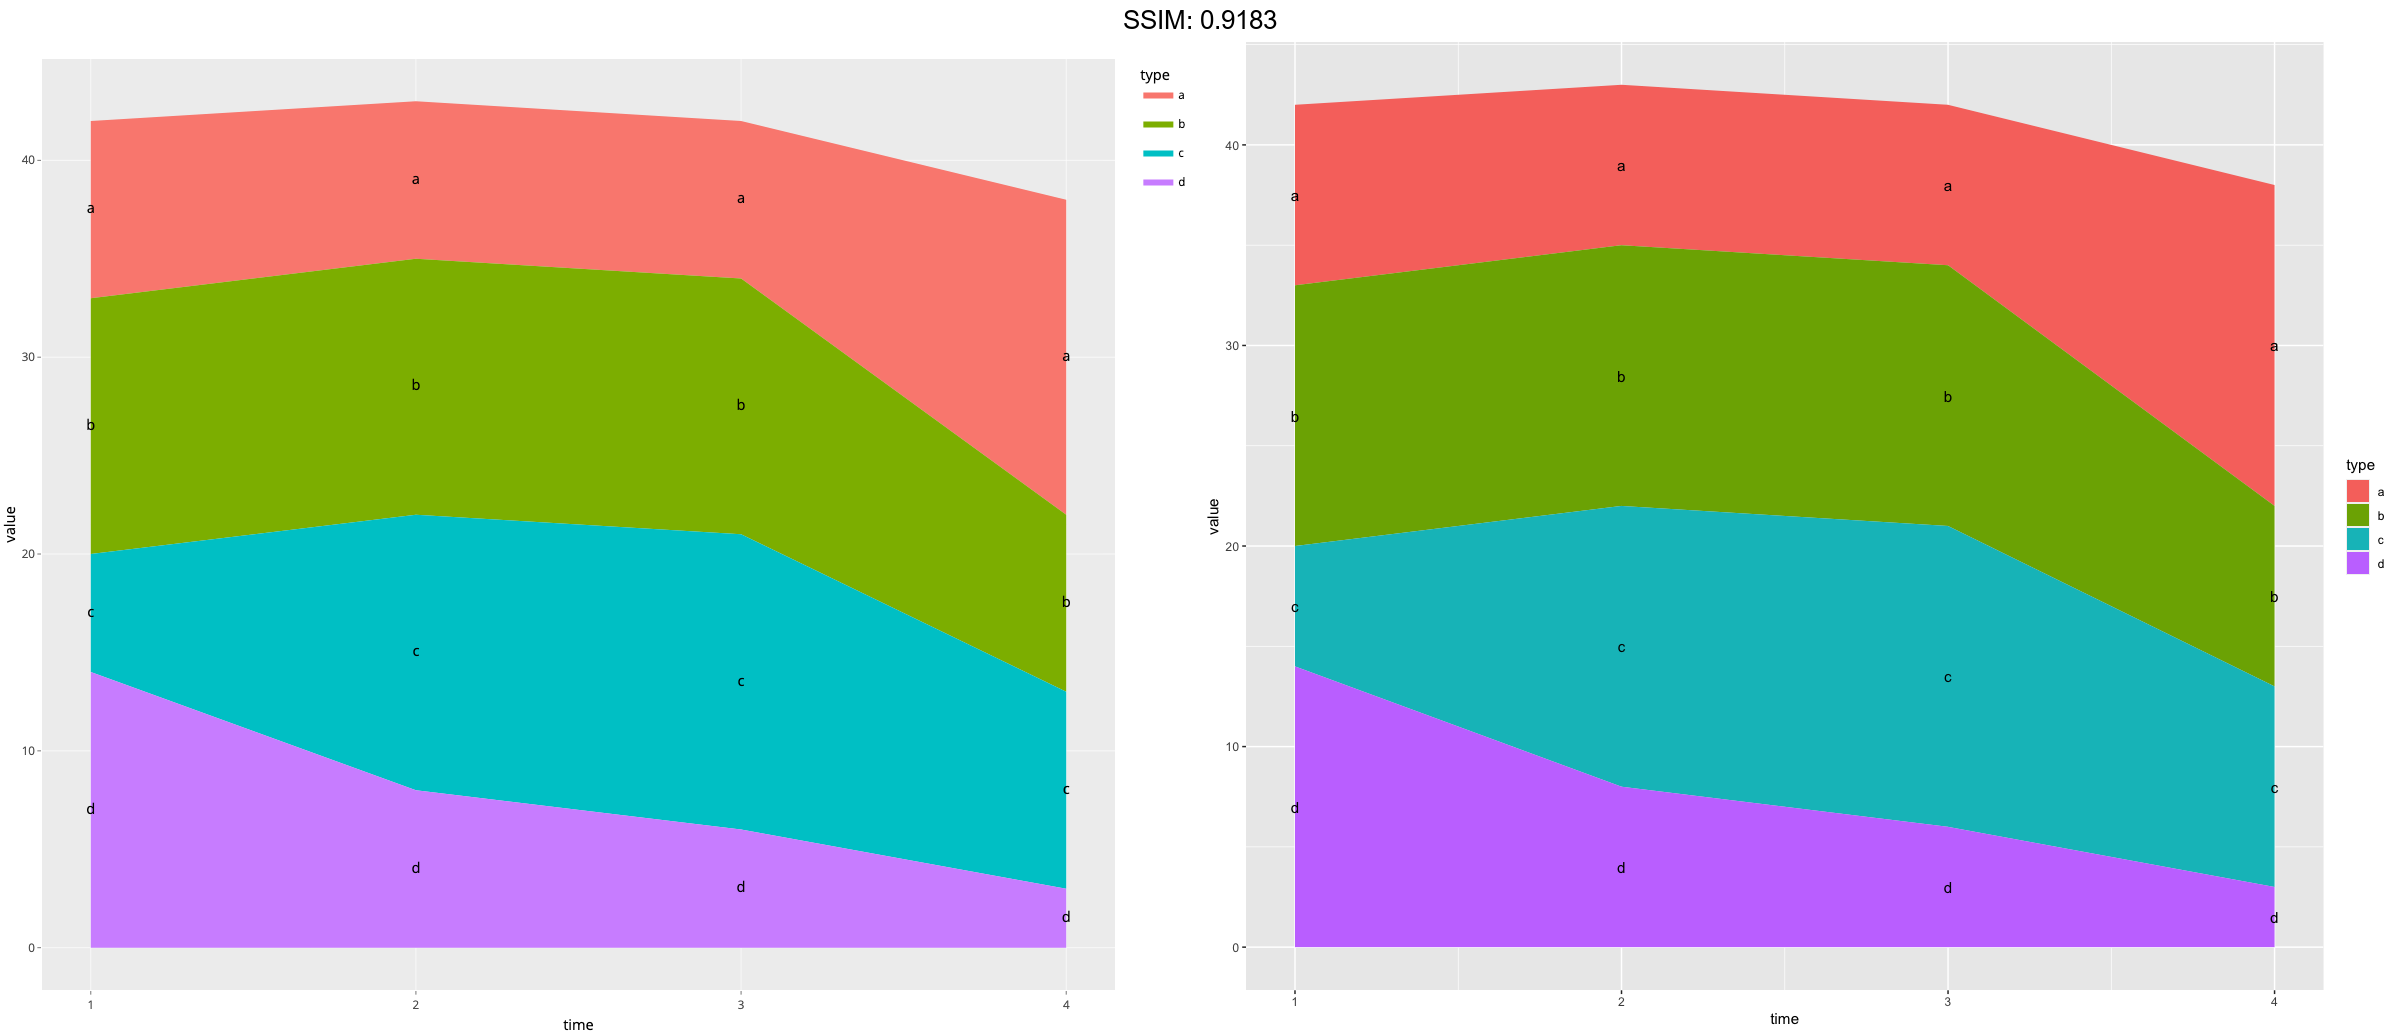
p <-
 ggplot(series, aes(time, value, group = type)) +
  geom_area(aes(fill = type)) +
  geom_text(aes(label = type), position = "stack")
plotly::ggplotly(p)


series <- data.frame(
  time = c(rep(1, 4),rep(2, 4), rep(3, 4), rep(4, 4)),
  type = rep(c('a', 'b', 'c', 'd'), 4),
  value = rpois(16, 10)
)
series$type2 <- factor(series$type, levels = c('c', 'b', 'd', 'a'))
p <-
 ggplot(series, aes(time, value, group = type)) +
  geom_area(aes(fill = type)) +
  geom_text(aes(label = type), position = position_stack(vjust = 0.5))
plotly::ggplotly(p)


df <- tibble::tribble(
  ~x, ~y, ~grp,
  "a", 1,  "x",
  "a", 2,  "y",
  "b", 1,  "x",
  "b", 3,  "y",
  "b", -1, "y"
)
p <-
 ggplot(data = df, aes(x, y, group = grp)) +
  geom_col(aes(fill = grp), position = position_stack(reverse = TRUE)) +
  geom_hline(yintercept = 0)
plotly::ggplotly(p)


df <- tibble::tribble(
  ~x, ~y, ~grp,
  "a", 1,  "x",
  "a", 2,  "y",
  "b", 1,  "x",
  "b", 3,  "y",
  "b", -1, "y"
)
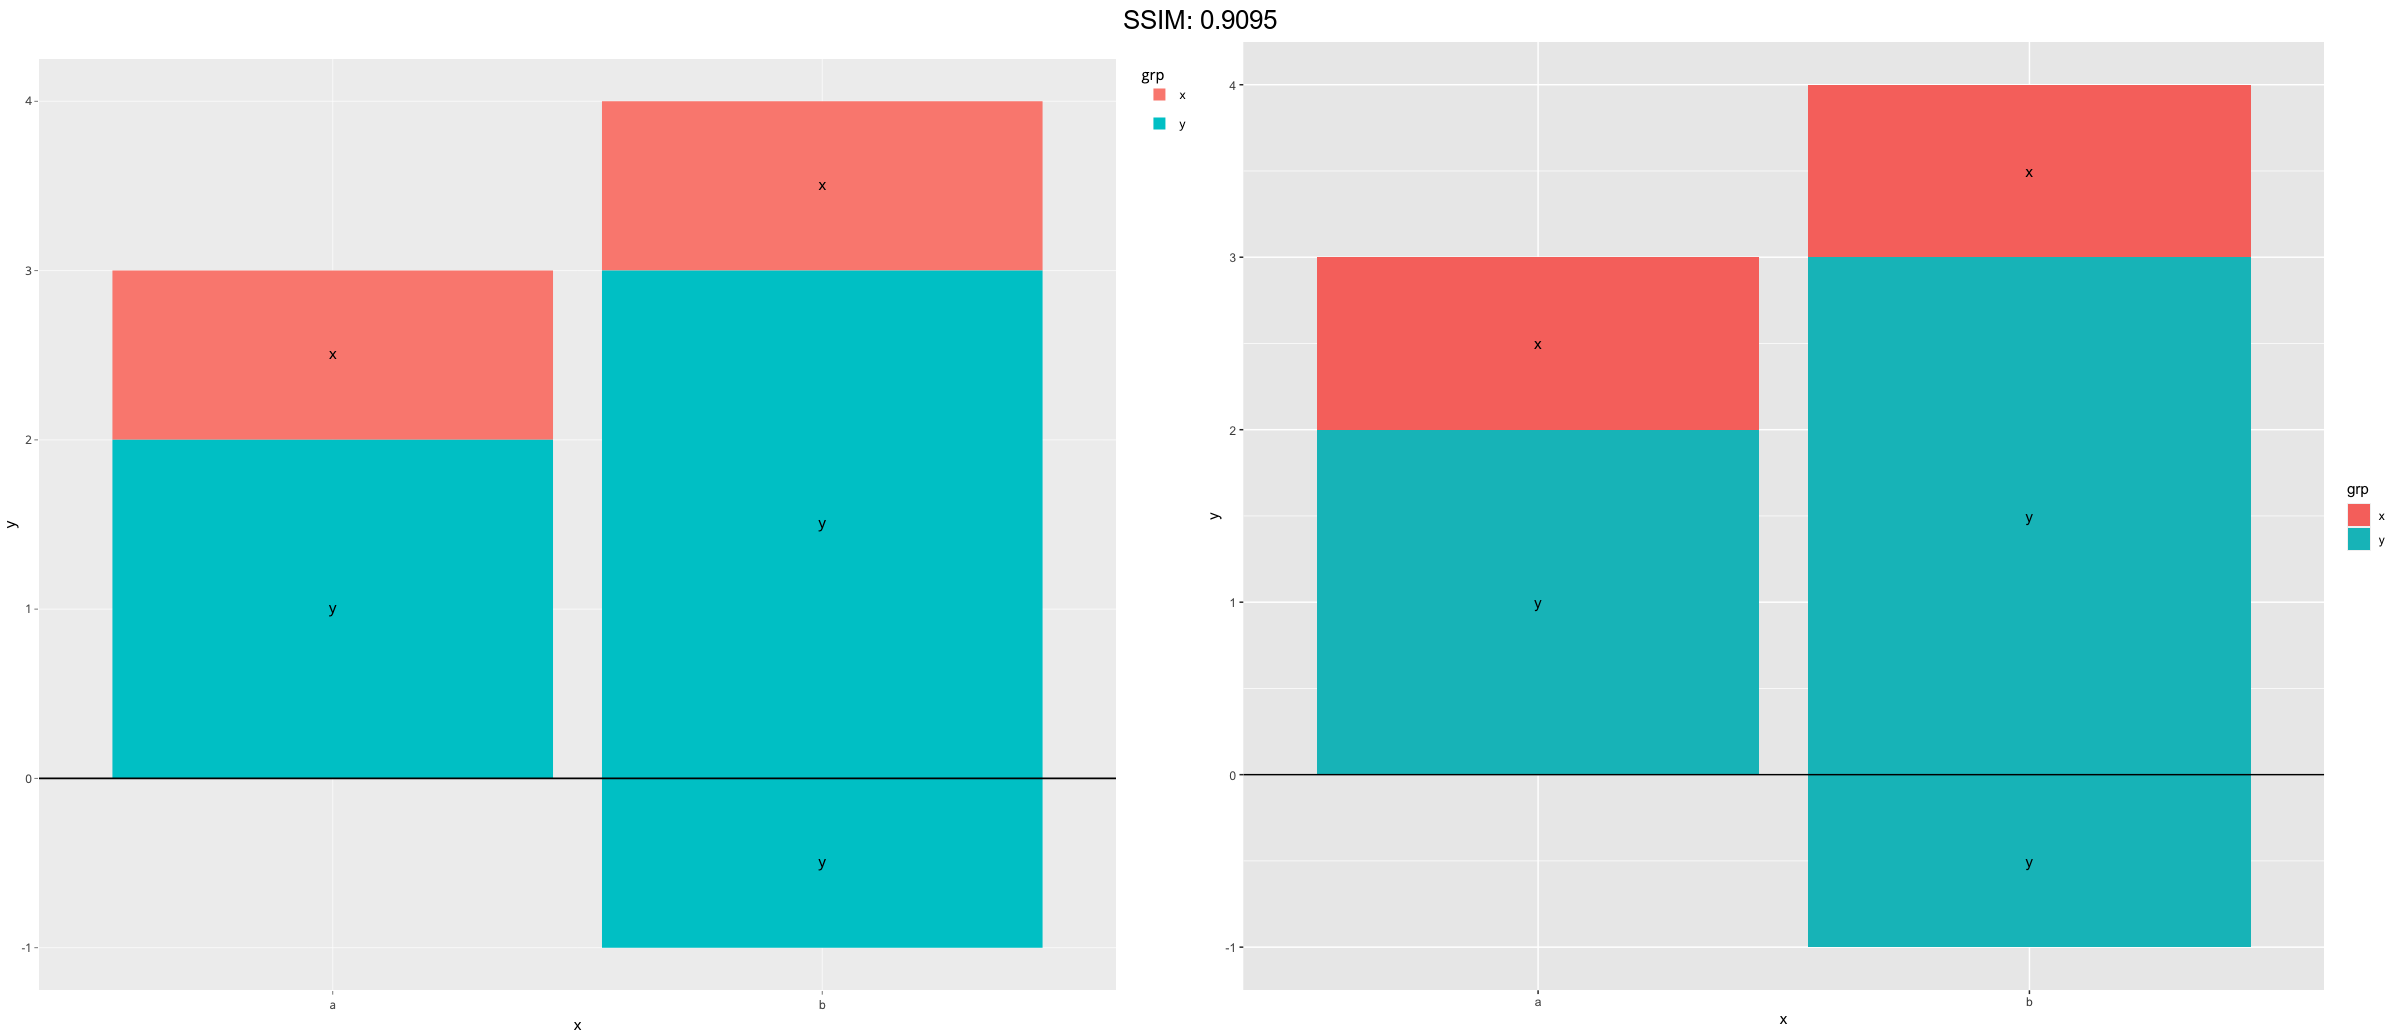
p <-
 ggplot(data = df, aes(x, y, group = grp)) +
  geom_col(aes(fill = grp)) +
  geom_hline(yintercept = 0) +
  geom_text(aes(label = grp), position = position_stack(vjust = 0.5))
plotly::ggplotly(p)

